“Do I Need to See This?
- A Data Visualization of 7 days of advertisement I saw on IG Stories
- A Data Visualization of 7 days of advertisement I saw on IG Stories
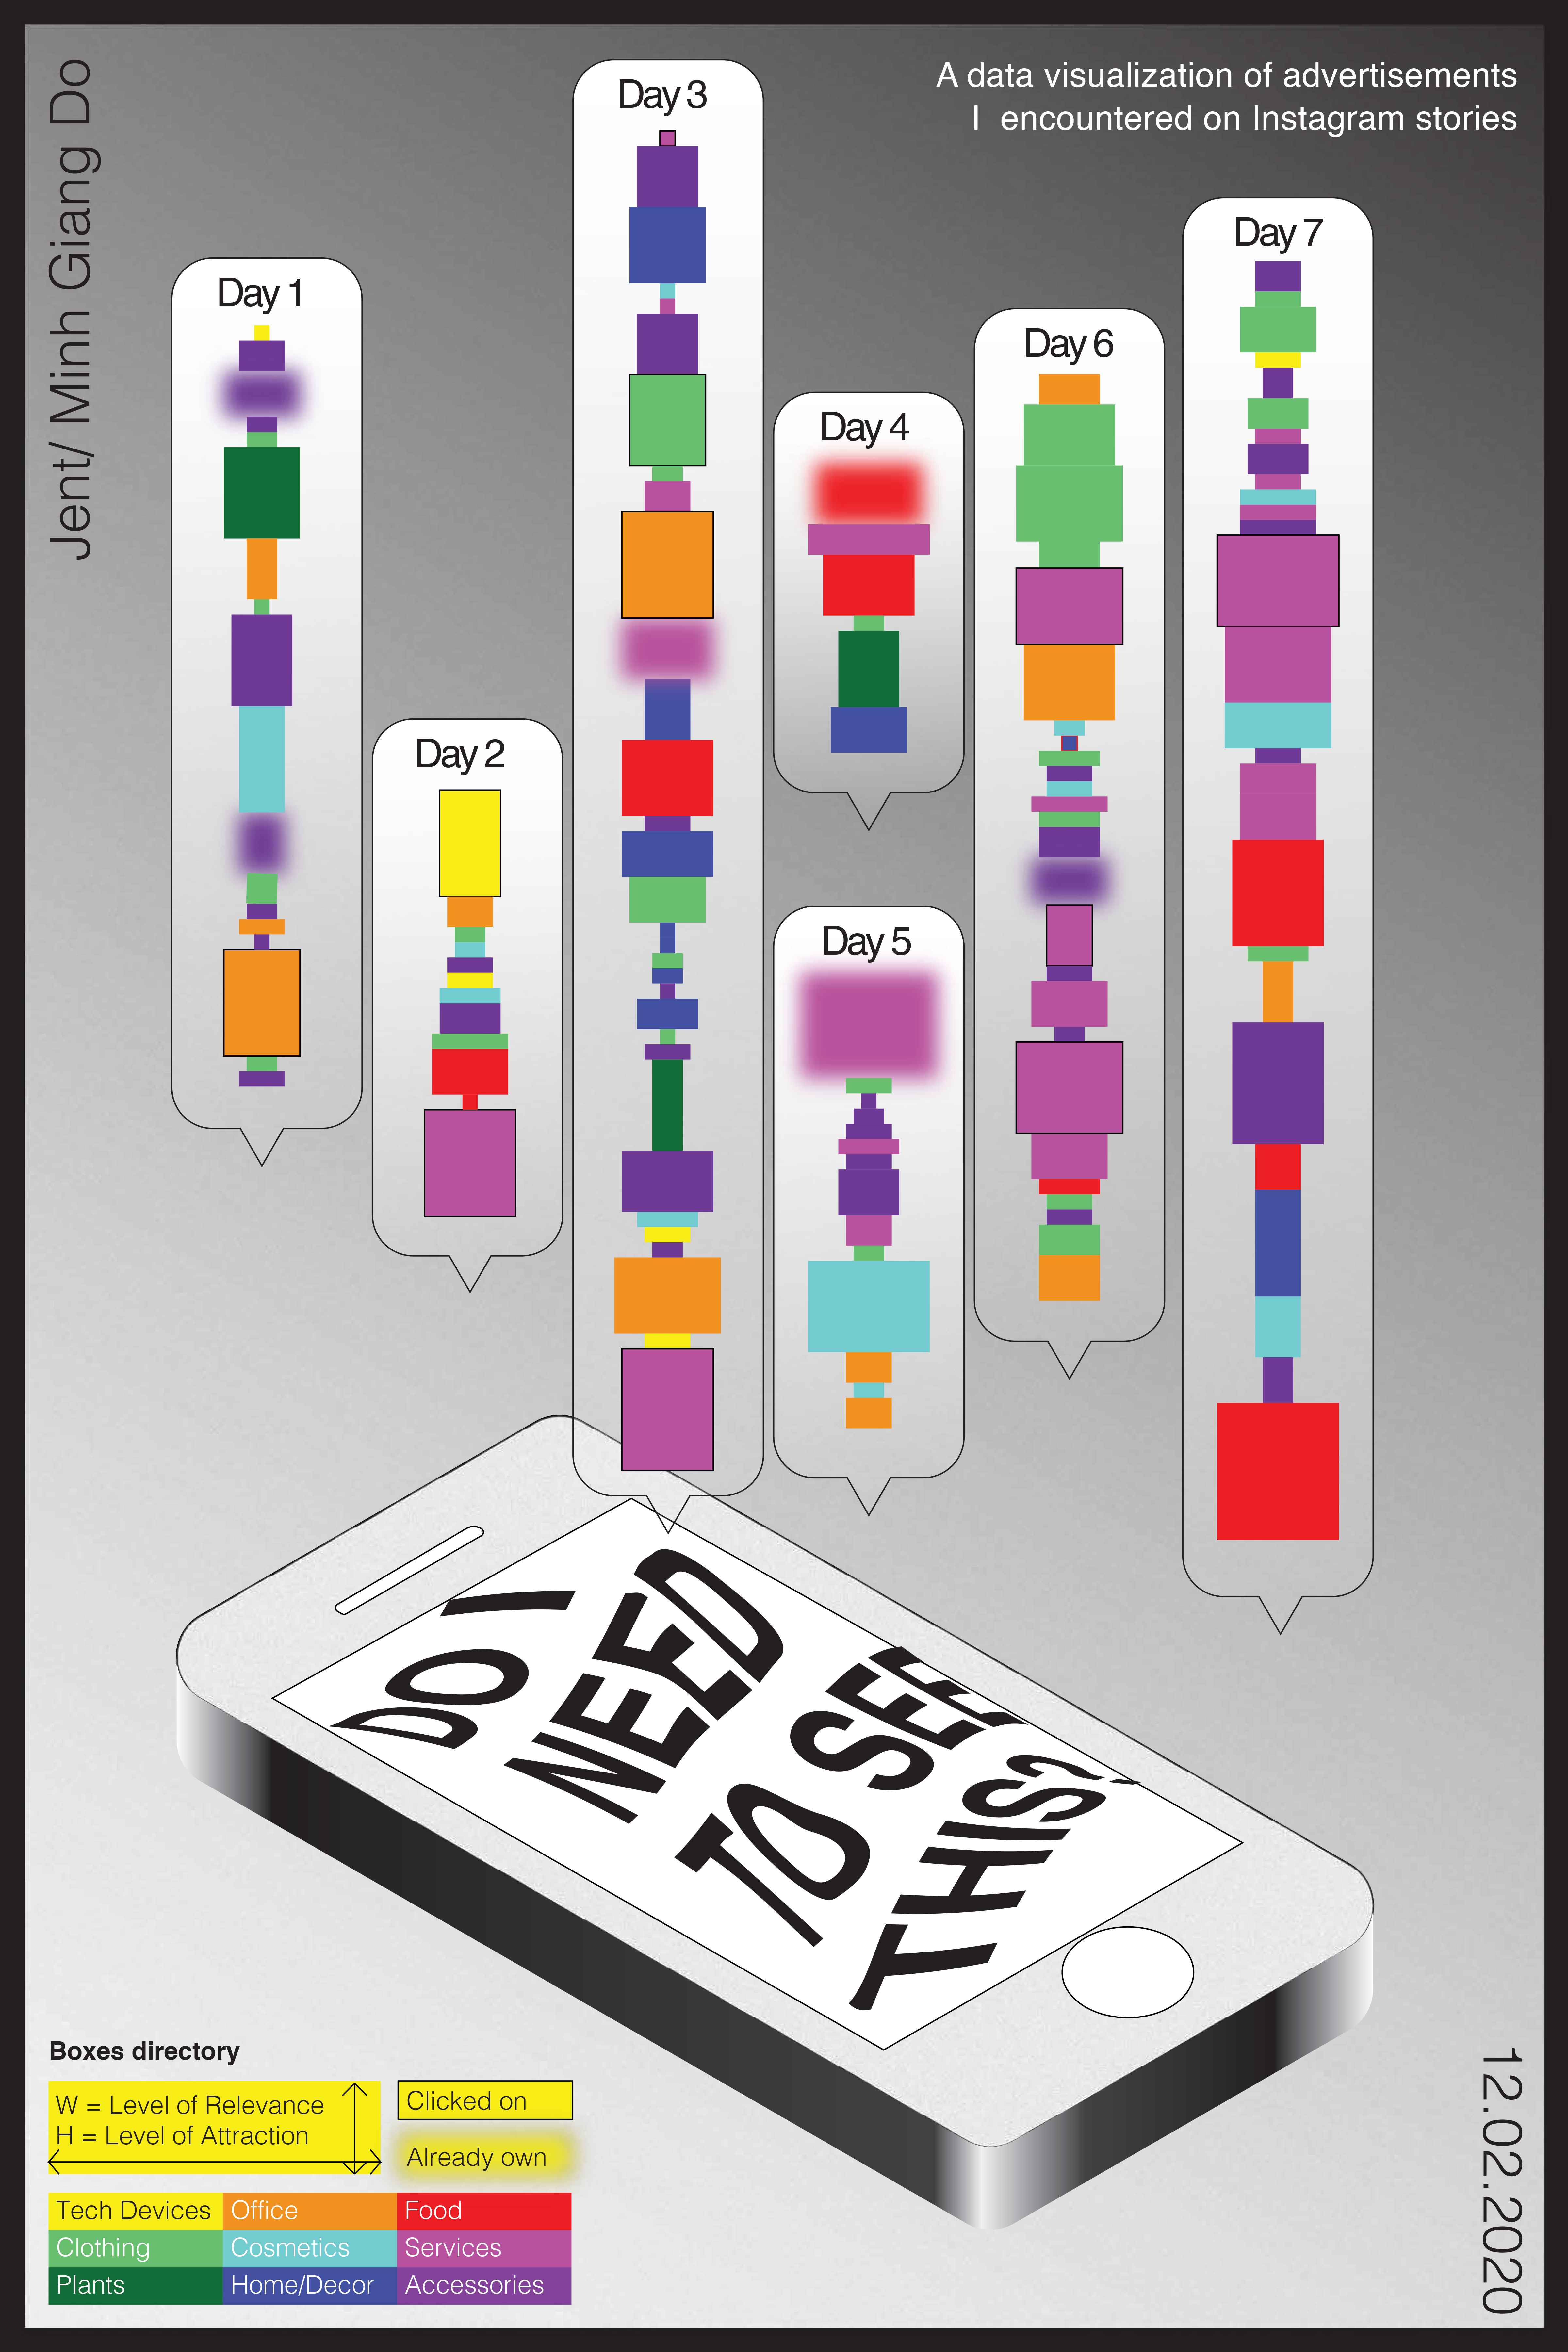
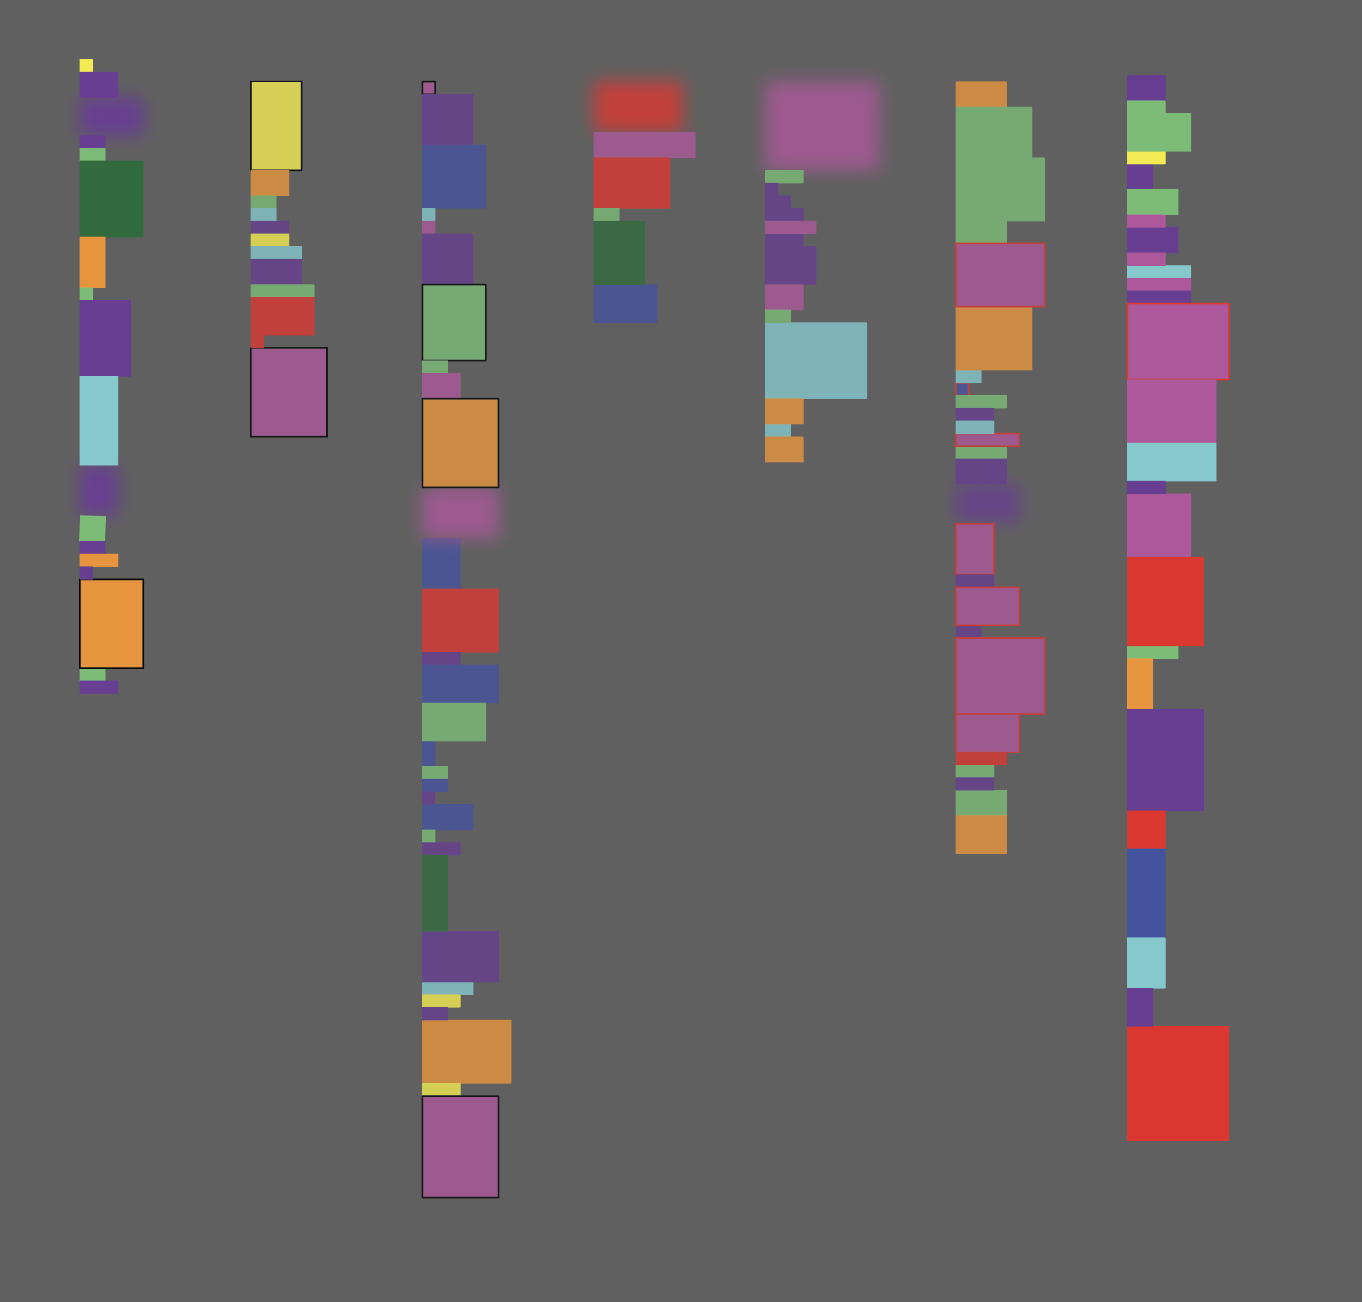
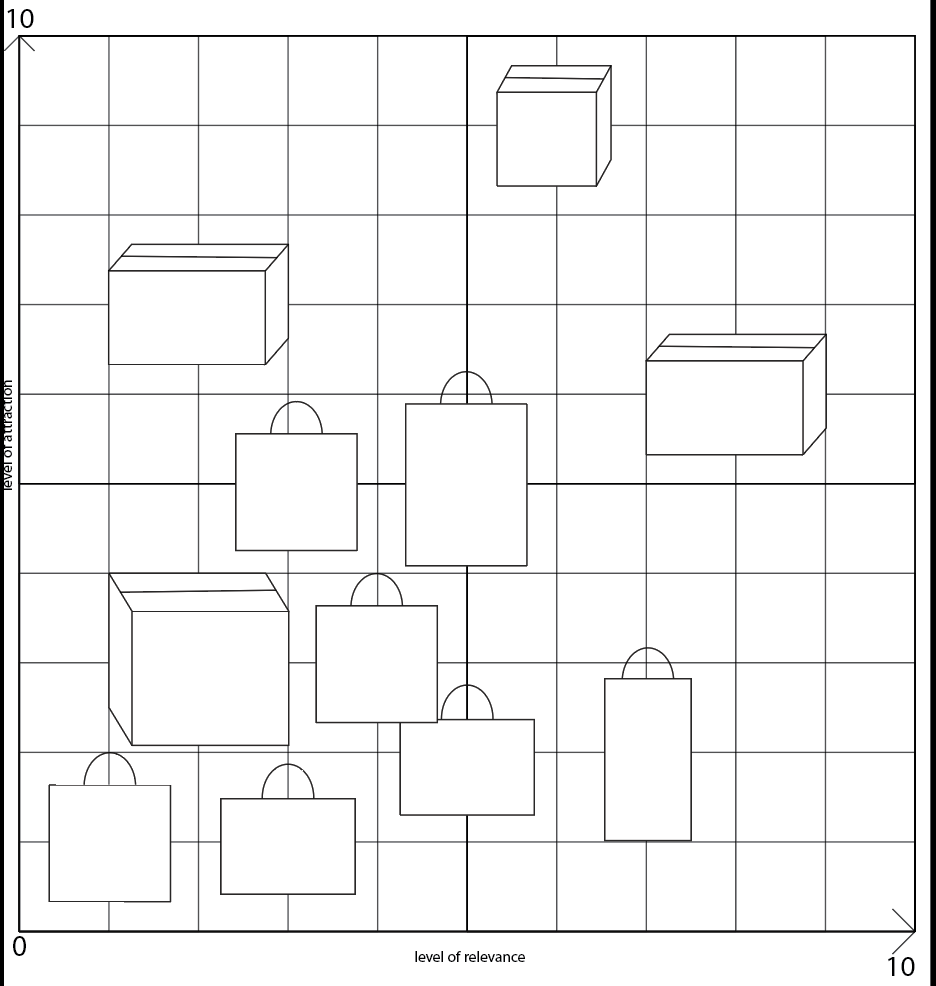
Inspired by mapping of information, this project is a data visualization of 7 days of advertisement I saw on Instagram stories. I created a grading system for each ad I encountered on IG story on two axis: level of relevance to my needs, and level of attractiveness that each ad brings me. The ads are then assigned a size based on the grading system, and color based on ad categories. Through the visualization of data, I reflected on my identity through the lenses of how the social media ads algorithm views me and my participation in consumerism.